To complement our series of QuickReads covering measurement, we will now explore the various data…

ChangeWise Quick Read: Pareto Analysis
In this quick read, we offer a high-level overview of the Pareto Principle, including where it comes from, what it is and how it can be applied to the work place to achieve improved operational effectiveness.

Photo by Austin Distel on Unsplash
What is the Pareto Principle?
The Pareto principle, also known as the 80/20 Rule, states that 80% of outcomes (effect) result from 20% of the inputs (or causes). In business, the idea is to identify and prioritise which inputs offer the most productive outputs. Simply put, Pareto is concerned with identifying the top portion of causes that need to be addressed in order to resolve the majority of problems.
We’ve made up some examples to help:
- 20% of coffee shops represent 80% of coffee sales
- 20% of my household members create 80% of the mess
- 20% of my company workforce complete 80% of the work
Where did the Pareto Principle Originate?
Vilfredo Pareto, an Italian economist in 1800’s, observed that a relative few people in the world held most of the wealth. He developed models to describe this non-uniform distribution of wealth; 20% of people (the vital few) hold 80% (majority volume) of the wealth. So, 80% of consequences come from 20% of causes – highlighting the unequal relationship between inputs and outputs.
80% of problems (effect) are produced by 20% (vital few) of causes
Pareto: Key Facts
⭐️ Pareto is a statistical technique for the ranked comparison of factors relating to a quality problem.
⭐️ It helps identify and focus on the vital few causes contributing to a significant overall effect
⭐️ It is helpful when prioritising which effects should be the focus for improvement
⭐️ Pareto is especially effective when combined with other Lean tools, such as the ‘fishbone’ (Ishikawa diagram), 5Whys technique and FMEA (Failure Mode Effects Analysis). This also prevents the risk of missing or failing to manage initially small impact issues that might develop into more severe problems later on.
Sounds good, can you give me an example?
Absolutely! The failure/error chart below should help:
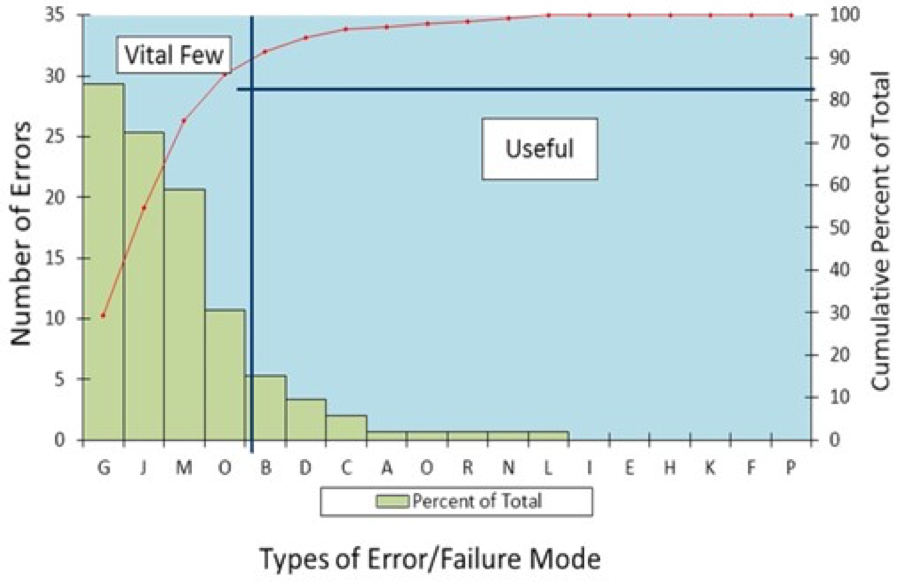
The above chart illustrates the basic elements of Pareto Analysis:
- Each contributor (error/failure mode) is listed in rank order, starting with the biggest
- The magnitude of the contribution is given numerically in the column (labelled Number of Errors)
- The cumulative percentage of total for the ranked contributors is listed in the column labelled Cumulative Percent of Total
Based on this Pareto chart, we can see that 80% of the defects are caused by factors G, J, M and O (which account for 20% of the overall defect modes/categories). Using the Pareto Principle, we would prioritise 20% of the defect modes (G, J, M and O) to resolve 80% of the overall error volume.
Interpreting Pareto Diagrams
Let’s use the Field Service Customer Compliant data below to help us understand how best to interpret Pareto Diagrams:
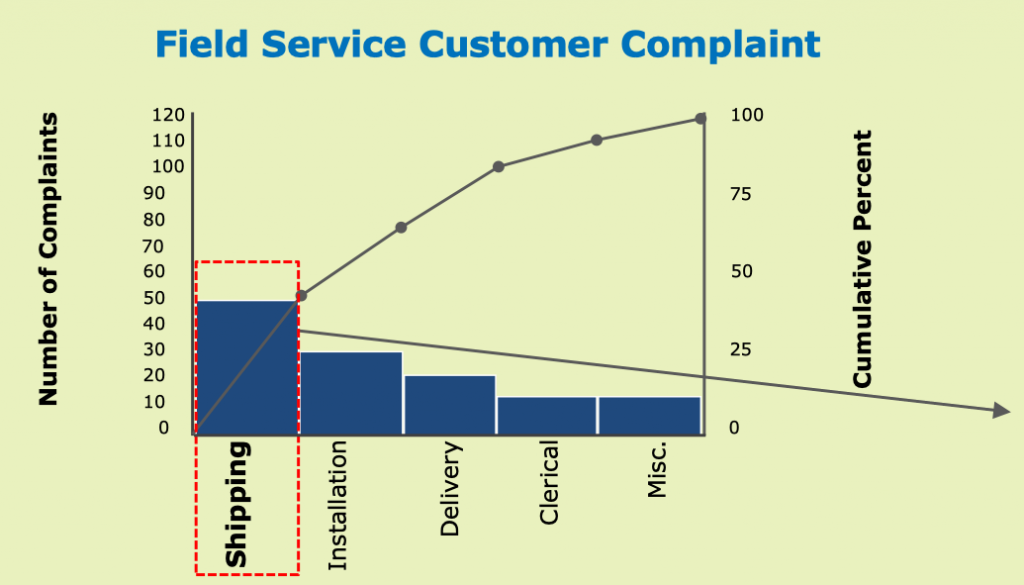
Where the slope flattens is the break point which separates the vital few from the useful many (as illustrated by the red box above). Our chart suggests that identifying and resolving the root cause for shipping complaints will reduce the majority of our complaints work.
⚠️ Important Point! It can be valuable to stratify data further by performing a number of Pareto analyses to fully understand the root causes.
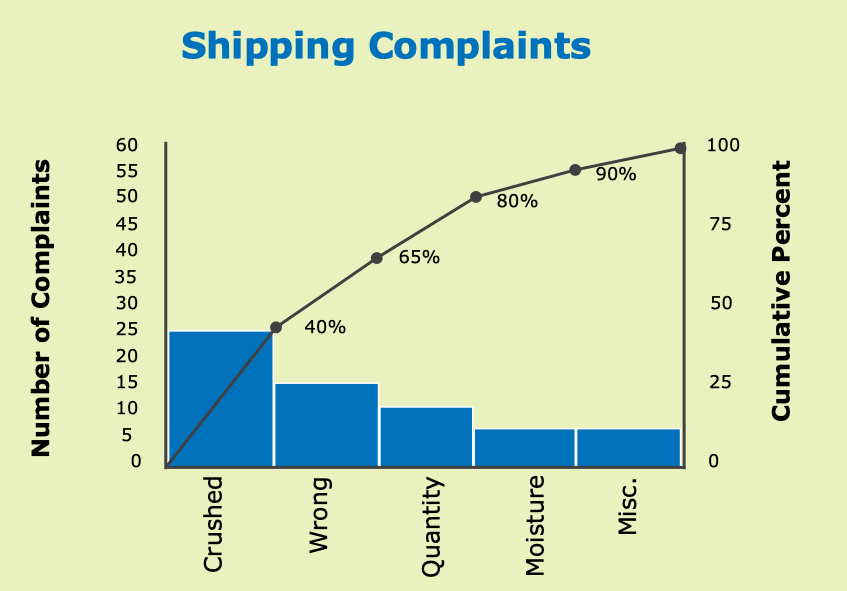
In the above chart, further analysis of Shipping Complaints will enable us to focus and refine our problem statement and analysis on the highest causes of shipping complaints. Based on the above Pareto diagram, we should prioritise eliminating the root cause for crushed packages.
👍 Top Tip! Once your Pareto analysis is complete and your root causes better understood, the Ease/Impact Matrix is a great tool for helping to prioritise solutions.
In Summary
The Pareto principle, also known as the 80/20 Rule, was first described by Vilfredo Pareto, an Italian economist in 1800’s. This principle states that 80% of outcomes (effect) result from 20% of the inputs (or causes). In business, the idea is to identify and prioritise which inputs offer the most productive outputs.
Further Reading:
ChangeWise QuickRead FMEA
ChangeWise QuickRead Ishikawa Diagram
ChangeWise QuickRead Categorising and Prioritising Ideas Part1/2
Want to know how Pareto can be used to significantly reduce demand and increase effectiveness within your organisation? Get in touch with the ChangeWise team at info@changewise.co.uk
ChangeWise believes employee engagement is the foundation for successful Change. Training and coaching your people to use simple continuous improvement techniques will enable your organisation to continuously adapt and stay ahead in a constantly changing and challenging environment.
For updates and interesting Lean Change insights, connect with us on LinkedIn.
Related Posts