To complement our series of QuickReads covering measurement, we will now explore the various data…

ChangeWise Quick Read: Measurement Series – Qualitative vs Quantitative; what’s the difference?
To complement our series of QuickReads covering measurement, we will now explore the difference between qualitative and quantitative data sets, when to use each one and how to further classify each type. Consider this another recap of your school Geography lessons! 📚
Qualitative vs Quantitative…..so what’s the difference?
Simply put, quantitative data refers to any data that can be counted, measured or quantified. This type of data is typically numeric. In contrast, qualitative data is more descriptive and usually described using words.
So how do I know which one to use?
Choosing which data type to use for your Lean improvement requires careful consideration but generally, opt for a quantitative method when trying to test something. For example, how many complaints are resolved within 5 days? How many complaints are caused by late paperwork submission? How many quality issues relate to feature A?
In contrast, qualitative data (or research) should be used for understanding thoughts and experiences; please tell us what you most enjoyed about your visit today? How do you think we could improve our customer experience?
Sometimes, we may require both data types to fully appreciate our customer needs and wants.
That makes sense, anything else I need to know before I get started?
Yes, you need to understand the four types of measurement that further stratify qualitative and quantitative data. These are Nominal, Ordinal, Interval and Ratio. Before we look at each of these in turn, I thought it might be useful to explain a few bits of terminology:
Attribute
This term refers to the quality of a characteristic or feature being measured. For example, counting the number of errors on a form.
Discrete vs Continuous Data
When we talk about ‘Discrete’ data we mean data that has a finite value, this could be clothing size or number of cars. In contrast, ‘Continuous (sometimes referred to as Variable)’ data , has an infinite number of possible values. For example, temperature or height.
Binary
The term binary is used when data can only take two forms, such as morning or afternoon, yes or no etc.
Got it! Now tell me about Nominal, Ordinal, Interval and Ratio data types please!
Of course, let’s go!
Nominal (attribute or qualitative)
Nominal data refers to categories or names of information that cannot be ordered since they are mutually exclusive. An example might be colours, locations, brands, products, etc.
This is the simplest form of measurement scale.
Ordinal (attribute or qualitative)
Ordinal data is non-numeric ordered categories, such as 1st, 2nd, 3rd, or strongly agree, agree, neutral, disagree, strongly disagree.
Ordinal data is popular because it is easy to compare between variables and simple to group.
Interval (quantitative)
Interval data is numeric data arranged in order with meaningful and exact differences. This includes data on an ordered scale such as temperature.
Interval data is more informative than attribute data types because we can add or subtract temperature readings and calculate statistics (such as mean and standard deviation). However, we cannot multiply, divide, or calculate ratios – because there is no true zero (since it is not possible to have no temperature).
Ratio (quantitative)
Finally, ratio data is considered the most informative of the four data types. This is because it has the same characteristics of interval data, with the addition of a ‘true’ zero, making it more suitable for supporting statistical models and analyses. Examples might include height, weight, annual sales etc.
As always, here’s a neat little table to summarise everything….
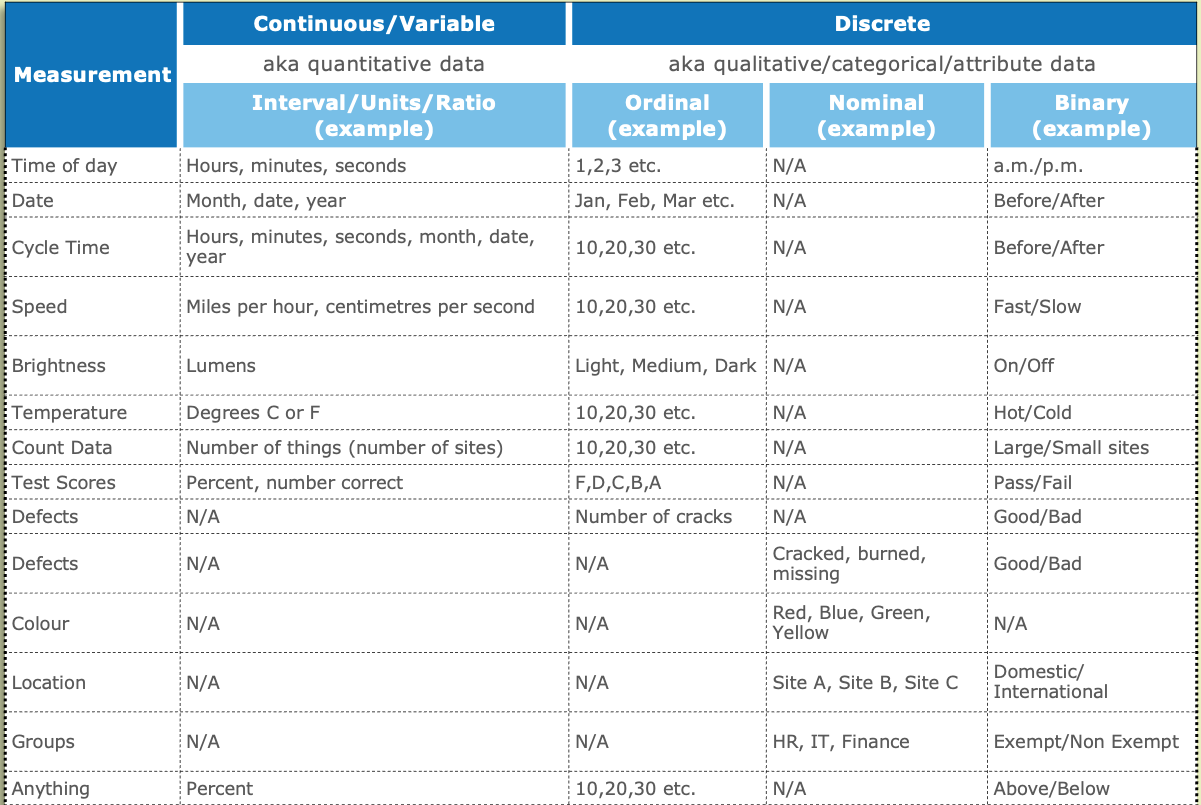
⚠️ Remember!! Making sure you collect accurate, meaningful data that adds real value to your lean improvement is more important than the amount or complexity of the data you collect.
In Summary
It is important to understand what questions need to be answered when considering data analysis since this will determine what data types should be collected. Data can be classified as qualitative or quantitative which can be further stratified into Nominal, Ordinal, Interval and Ratio data.
Looking for more information? Get in touch with the ChangeWise team at info@changewise.co.uk
For related articles, visit us at ChangeWise news:
- The Data Collection Plan
- Measurement Categories
- Clarifying Customer Requirements; CTQ Measures
- Sourcing Customer Voice
- The Issue with Data
ChangeWise believes employee engagement is the foundation for successful Change. Training and coaching your people to use simple continuous improvement techniques will enable your organisation to continuously adapt and stay ahead in a constantly changing and challenging environment.
For updates and interesting Lean Change insights, connect with us on LinkedIn.
Related Posts